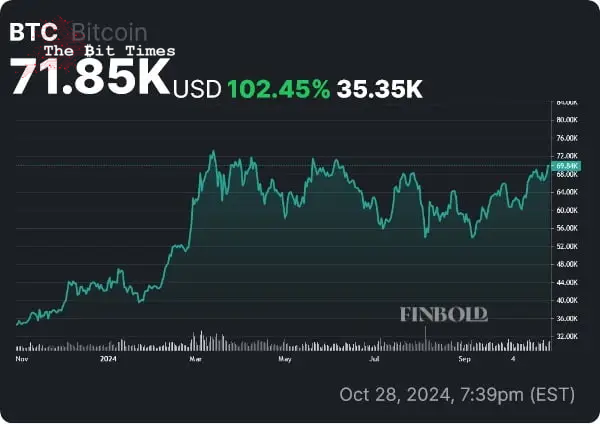
Bitcoin is just 2% away from breaking its all-time high
At the tail end of a month that saw numerous false breakouts, Bitcoin (BTC) has finally surged above the psychologically important $70,000 level — for the first time since June.
The pioneering cryptocurrency is trading at $71,850 at the time of publication — having rallied by 102.45% compared to this time last year.
Several key technical indicators are suggesting that this could be the start of a prolonged rally.
Picks for you
With just two days left to go, it’s beginning to look like ‘Uptober’ could end on an even higher note.

Bullish signals abound as BTC breaks resistance
Bitcoin has been struggling to decisively break through the $70,000 price point for almost six months at the time of writing.
This latest move to the upside will almost certainly reignite the confidence of traders and investors — BTC has seen 15 green days over the course of the last month, and this latest breakthrough comes at a price point that is near both the all-time high and the cycle high.
In fact, the leading digital asset has managed to not only outperform its closest comparison, Ethereum (ETH) — it has also outperformed 59% of the top 100 crypto assets when looking at a 1-year chart.
Institutional adoption has also been a key factor that has enabled this surge — with exchange-traded funds (ETFs) like iShares Bitcoin Trust ETF (NASDAQ: IBIT) going a long way in making BTC more accessible to regular retail investors and securing higher liquidity through inflows.
This could prove to be a significant catalyst going forward — VanEck, one of the most notable institutional investors, sees the cryptocurrency becoming a global reserve asset that could reach prices as high as $3 million by 2050.
Investors and traders should exercise caution amid BTC surge
While there are plenty of reasons for optimism, readers should note that that is, in turn, no reason to abandon proper risk management. At press time, a key technical indicator, the relative strength index (RSI), is at 70 — signaling that the asset has entered overbought territory.
This does not mean that a correction or retracement will follow — however, as pointed out by crypto expert Alan Santana, additional confirmation is needed before the veracity of the bull run can be determined.
To boot, testing both cycle highs and all-time highs is a tall order — and before that happens, traders should keep an eye out for a resistance level at $72,625.90 and a support level at $69,307.20, as identified by Finbold.
Should Bitcoin surpass that level of resistance, the all-time high at $73,750 will remain as the final obstacle that will confirm or deny a prolonged upswing.
Featured Image:
ViewFinder nilsophon — December 25, 2019. Digital Image. Shutterstock.
Comments
Post a Comment